
The department you're proudest of is probably your biggest blind spot
Every garden centre has a department the owner loves. It looks beautiful, it wins compliments from colleagues, and often it quietly eats margin. Not because it's badly run, but because nobody ever measured it against the space it occupies.
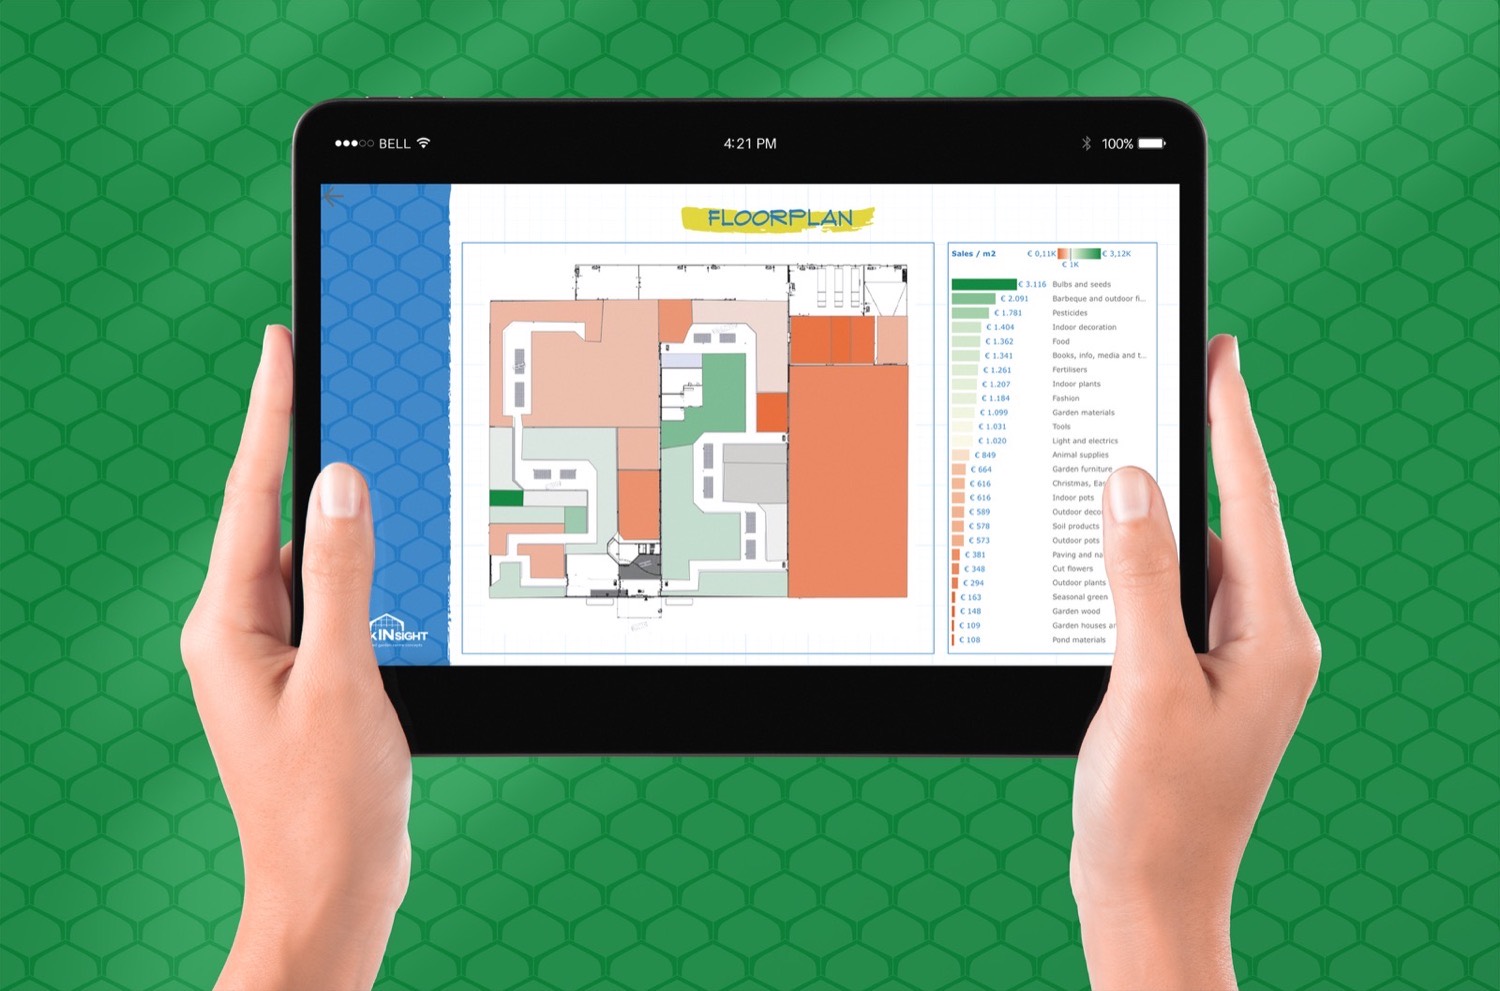
Turnover hides what square metres reveal
Ask an owner which department performs best and you'll usually hear the one with the highest turnover. That is a fair answer, and an incomplete one. A department that turns over €600,000 across 900 m² earns €667 per square metre. One that turns over €150,000 across 90 m² earns €1,667 — two and a half times as much from a tenth of the floor. On the turnover ranking, the first looks like the winner. On the rent, the staff hours and the replenishment work, the second one is.
Square metres are the one resource a garden centre genuinely cannot expand at will. Every metre you give to one category is a metre withheld from another. That makes sales per m², and margin per m² — the only honest way to compare departments that sell wildly different things.
A garden centre's biggest blind spot is the department it's proudest of.
Why the proud department is so often the culprit
Pride and floor space tend to grow together. A department someone cares about gets the extra table, the wider aisle, the seasonal build-up, the prime spot near the entrance. None of those decisions were wrong on the day they were made, but they compound. Thirty years of small, well-meant expansions produce a layout that reflects a history of enthusiasm rather than a concept.
Meanwhile the departments that quietly earn — bulbs and seeds, indoor plants, pots — often sit in whatever space was left over. In the analyses we run, the top-earning category per square metre is almost never the one the owner nominated beforehand.
Four questions that expose it
- What is turnover per m² per department? Not per store, per department. The spread is usually a factor five or more.
- What is margin per m²? A high-turnover department on a thin margin can rank below a modest one on a fat margin.
- How does each department compare to a benchmark? Your own numbers only tell you your internal ranking. Comparable European centres tell you whether your best is actually good.
- Which departments are destinations and which are impulse? A low-earning department at the back may still be the reason customers drive to you. Square metres are not the whole story, but you cannot weigh that trade-off until you've measured it.
What to do with the answer
The point is not to shrink whatever ranks lowest. Some departments earn their space in traffic rather than turnover, and cutting them can cost more than they return. The point is to stop guessing which is which, and to make the next layout decision with the numbers on the table instead of a hunch.
In practice this is where data and instinct have to meet. The analysis tells you where your centre earns and where it leaks. Your knowledge of your customers tells you what belongs there instead. A concept founded on both survives contact with reality; one founded on either alone usually doesn't.
Curious what your own floor says?
A Data & Department Scan puts sales and margin per m² per department on one page, benchmarked against comparable European garden centres. Fixed scope, delivered in weeks, one clear recommendation, and no obligation to continue.
Request a data scan