
The Data & Department Scan
Your full till data against the European set — every department, turnover and margin per m², floorplan heatmap, and one clear recommendation. Fixed scope, delivered in weeks, no obligation to continue.
Request the scanSix numbers is all it takes. Enter your surface and turnover (in total and for three departments) and see instantly where your euro per m² sits against European garden centres.
Gives you your position. What it means for your mix, your pricing and your floor plan is the work we do together.
A position on a curve is a starting point, not a decision. Deliberately outside this free tool — because it needs your real data, your market and a conversation:
You get the European Garden Centre Benchmark as a pdf, right here on this page: every curve, the spread, the taxonomy in full. We e-mail you the link as well.
Free, no account, and you do not have to wait for it.
Open it below. We have also sent the link to your e-mail address, so you can find it again later.
You also asked for the next edition. We sent one e-mail to confirm that address; click the link in it and you are on the list.
You are already on the list for the next edition, so there is nothing left for you to do.
You also asked for the next edition. That did not go through automatically, so we will add you by hand.
Your full till data against the European set — every department, turnover and margin per m², floorplan heatmap, and one clear recommendation. Fixed scope, delivered in weeks, no obligation to continue.
Request the scanReach, population, purchasing power, housing structure and competition, benchmarked against 112 European reference locations. The Compact Version: all the hard numbers, delivered in 10 working days.
Explore the Location ProfileEvery location in the set is measured this way, and the tool asks you for exactly the same thing. Comparing differently measured floors is worse than not comparing at all.
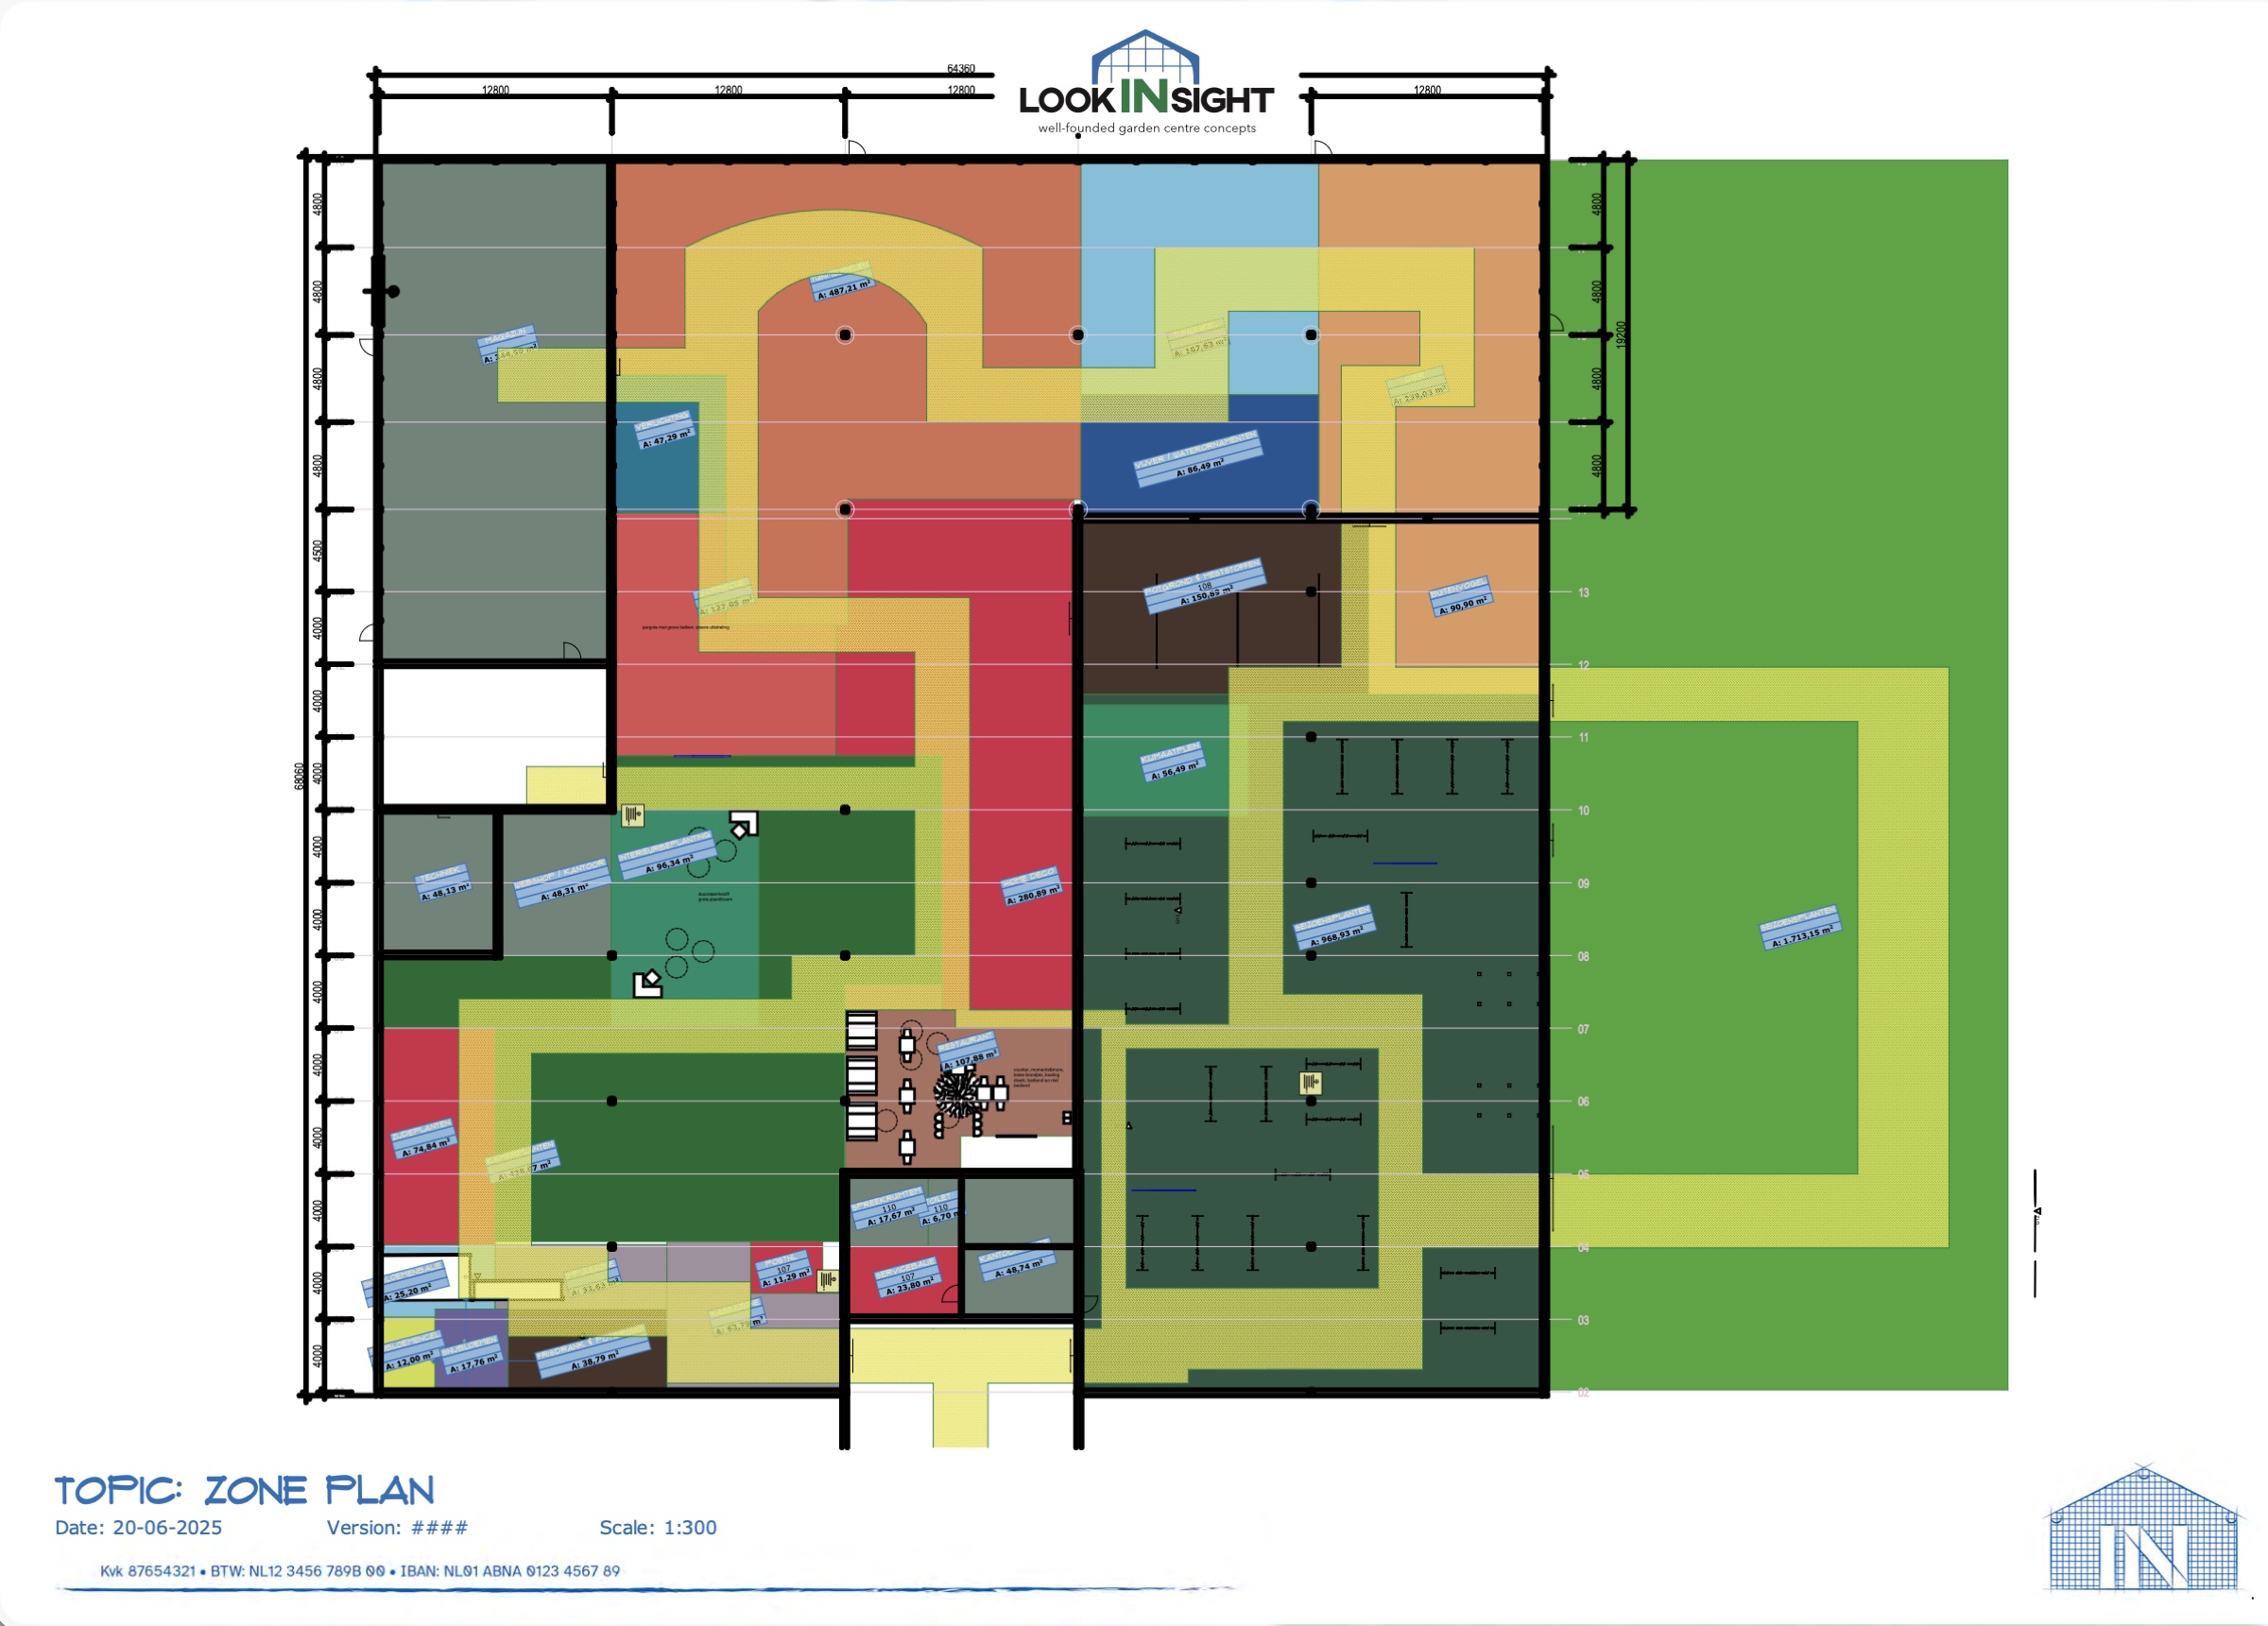
In our own projects this is done once on the floor plan: the plan is zoned, and every square metre in it belongs to one group or is split between two. If your own figures are measured differently, the comparison will be off — usually by more than the differences you are looking for.
Comparing garden centres only works if everyone is measured the same way. This is how we do it, and where the limits are.
Every location is mapped onto the same 30 H-groups before anything is compared. Without that, "garden furniture" in one centre is "outdoor living" in another and the numbers mean nothing. The full taxonomy is published below.
We report the median and the quartiles. One giant centre cannot pull the reference up, and your position is expressed as where you sit in the spread, not as a single "target" figure.
Every line shows its n. Where a country has too few locations to stand on its own, you are compared with the full European set and the tool says so — rather than quietly pretending to a precision it doesn't have.
The reference set holds five points per distribution — no records, no names, no single centre that can be reconstructed. Individual client data never leaves the project it belongs to.
The free tool compares turnover per m². Margin per m² — often the more uncomfortable number — is part of the Data & Department Scan, because it needs your real purchase data.
Data from 132 locations in 11 countries has been through our analysis. 54 of them meet the standard for the whole-store comparison, and 22 report every product group separately. We publish all three numbers rather than the flattering one. Edition: —.
Comparing centres only works if everyone counts the same things. These are the product groups every location in the benchmark is mapped onto. Use them, cite them, map your own reporting to them — that is the point of publishing a standard.
What we publish is the standard, not the table behind it. Compare three groups at a time in the tool above — that is the free service. The complete picture across every group, with margin per m² and what it means for your floor, is the Data & Department Scan.
Gaps in the numbering (H02, H04, H05, H08) are groups that were merged into their neighbours as the taxonomy matured. The numbers are kept stable on purpose — a code that changes meaning is worse than a gap.
Cite as: lookINsight H-group taxonomy, edition —. Free to use, attribution appreciated.
The full edition, every curve, the spread and the complete taxonomy, is not on this site. You can have it as a pdf: get the {ed} edition →